I’ve been very interested in an “old” blog post by Figma’s CTO Evan Wallace about how Figma manages to sync documents between clients and resolve any conflicts that occur. After looking at various CRDT libraries and frameworks (which still interest me greatly) this blog post and it’s simplicity really caught my eye.
I won’t repeat the post here, but simply highlight the key parts:
The server stores properties about an object/document. Each property is stored/processed separately to all others
When a property is changed on the client, the client first adds a object/property tuple to a unconfirmed change list (for later reference) and then sends the change to the server
The server receives the change, saves to persistent storage and then sends the change out to all other clients working on the same object
The client receives the change from the server and compares to the change list:
If there is no object/property match in the change list, then apply change to client
If there IS an object/property match to the change list but it did NOT originate from this client, then this is considered a conflict and we discard the change. This is due to we are expecting our OWN change to be returned by the server in the near future and would then overwrite this change.
If there IS an object/property match and it DID originate from this client, then remove it from the change list
The biggest gotcha/surprise with this approach is that obviously the server HAS to send all the changes to all the clients in the exact same order. To keep the simplicity this means that an object can only exist on a single server at a given time. No horizontal scaling for us. This isn’t as problematic as it appears due to the idea that the number of clients subscribed and manipulating the same object is expected to be low. Or at least low enough to not cause a problem for a single server. Though (some limited) testing, this doesn’t appear to cause a problem. If the server dies, another can be started extremely quickly, the clients reconnect and all the user noticed might be a tiny stall.
Now, if you wanted to make sure the server can horizontally scale then the problem of guaranteeing order regardless of which server responds needs to be resolved. But it’s not on my todo list 🙂
I have implemented cross platform versions of the server and client . These are both Go implementations although I’m planning on a some other client libs (maybe C#/Python/Rust?) in the future.
Grafana has done a wonderful job making it easier to create Datasource plugins. Previously I’d found it extremely painful to do but now, it is a breeze and a lovely experience. Disclaimer…. I’m talking about the Go based ones…. absolutely no idea about any other backend plugins.
Before reading this post, go and do yourself a favour and go and read their tutorial around this.
I’ll wait….
Back? good.
So far I’ve written up 3 datasource plugins that I’ve personally found useful in my day job. These are Datadog logs, Sendgrid stats and Azure Costs . Each of these follow the exact steps set out in the Grafana tutorial linked above.
Datadog Plugin
Grafana already has an official Datadog plugin, but 1) it’s for Enterprise customers only… and 2) I just need some basic log dashboards and not monitoring around everything Datadog does. The DD plugin I wrote simply graphs out the counts of log entries based on custom queries. My custom queries is virtually always "how many errors in prod" since hey, that’s what I REALLY care about. Certainly plenty of optimisations I need to get around to doing (like calling DD stats APIs as opposed to actually getting the logs and counting them)
SendGrid Stats
I monitor/alert on multiple Sendgrid accounts, so it’s useful to have a graph of the usual SendGrid stats (sent, bounced, blocked etc etc). Very convenient for a single place to glance at multiple accounts to see how things are tracking.
Azure Costs
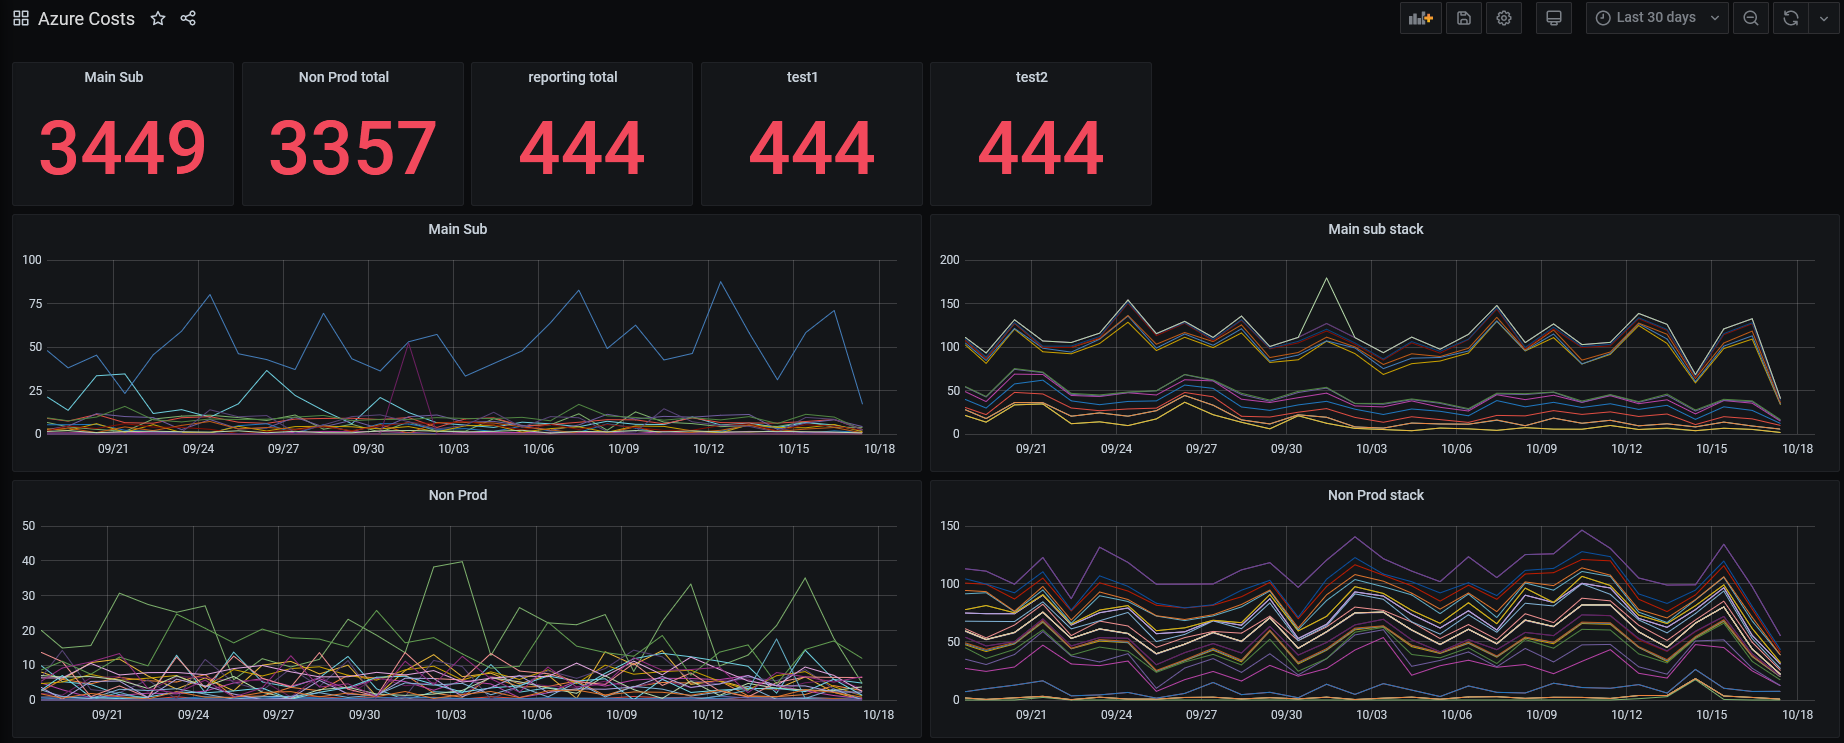
This will probably be the most useful (to me) of the three I’ve written so far. Monitoring Azure Costs (at subscription or resource group level) is always fun if you’re just bouncing between various screens on the Azure Portal. Of course there are already other services that I can subscribe to for summaries and deep dives into expenses, but what I was really after is a simple set of line graphs showing the various expenses for subscriptions and resource groups. This way I can easily see what services are creeping up in costs, or if something has been scaled up for too long. One useful thing I’ve found is generating 2 sets of line graphs with the same data. One stacked and the other not.
The stacked graph allows me to basically see how much a particular subscription is costing me per day, the non-stacked makes it easier to determine which individual resource group is costing the most.
Example of this dashboard :
Again, plenty of work to do on this one, in particular a mutex that protects a cache is far too coarse and not fine grain enough. It basically forces all queries to be serial instead of concurrent. But… given the data only updates once every 24 hours for Azure Costs it really isn’t a concern for me right now. This definitely gives me the "glanceability" I’m after.
I thoroughly recommend anyone who has given Grafana backend coding an attempt in the past and gave up, give it another go… it’s such a good experience.
The best way I find to learn a programming language/library/framework is to actually use it, not just read about it (he says writing a blog post). So to help me iron out the MANY rough edges of GoUI I’ve decided to start writing an app. A basic but (hopefully) fully functioning app. Each major change I do to GoUI will involve be either rewriting or modifying the app to use the latest and greatest features of GoUI.
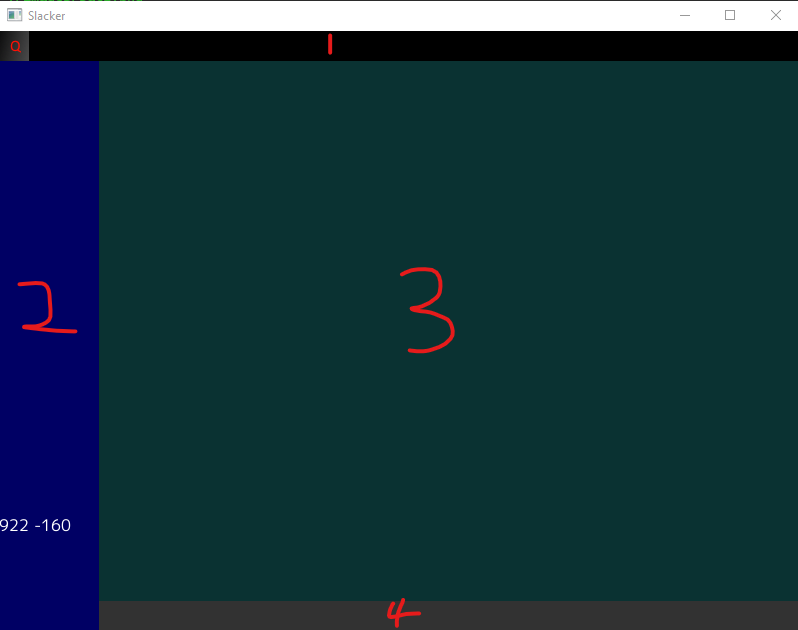
I’ve decided on a basic Slack messaging app. Not because I need one (well, I could do with the RAM back if I’m honest), but because it’s features from a UI pov I think are fairly well understood. We have a list of contacts/channels, we have messages related to that contact/channel and we have an area to type. Simple, but a practical example.
The code for this is on Github . The key part I want to focus on for this small blog post is the arranging of the various VPanels and HPanels used to make the rough interface. This is just a short post on what the rough outline of the app will look from a UI point of view.
Here is the current look:
The basic outline is this:
Is the toolbar. Currently just a quit button on it.
Will contain the various contacts/channels that the user can select
Will contain the messages related to the contact/channel selected
Is where you’ll type your new message
Now for the code.
func (s *Slacker) SetupUI() error {
	// This is #1, the toolbar
	tb := widgets.NewToolBar("toolbar", &color.RGBA{0, 0, 0, 0xff})
	quitButton := widgets.NewToolbarItem("quitTBI", s.QuitSlacker)
	tb.AddToolBarItem(quitButton)
	tb.SetSize(800, 30)

	// Main VPanel of the app. Will have 2 entries in it. The first is the top level toolbar
	// secondly will be a HPanel to have contacts and messages.
	vpanel := widgets.NewVPanelWithSize("main-vpanel", 800, 600, &color.RGBA{0, 0, 0, 0xff})
	vpanel.AddWidget(tb)
	s.window.AddPanel(vpanel)

	// main Horizontal panel... first element is channels + people
	// second element is actual chat.
	mainHPanel := widgets.NewHPanel("hpanel1", &color.RGBA{0, 100, 0, 255})

	// This is number 2, the side contacts.
	// contactsVPanel goes down complete left side, 100 width, 600-30 (toolbar) in height
	contactsVPanel := widgets.NewVPanelWithSize("contactsVPanel", 100, 570, &color.RGBA{0, 0, 100, 0xff})

	// This is a VPanel will will contain both 3 and 4 (messages and typing)
	// In messagesTypingVPanel we will have 2 vpanels.
	messagesTypingVPanel := widgets.NewVPanelWithSize("messagesTypingVPanel", 700, 570, &color.RGBA{0, 50, 50, 0xff})

	// Number 3... the messages
	messagesVPanel := widgets.NewVPanelWithSize("messagesVPanel", 700, 540, &color.RGBA{10, 50, 50, 0xff})

	// Number 4... typing
	typingVPanel := widgets.NewVPanelWithSize("typingVPanel", 700, 30, &color.RGBA{50, 50, 50, 0xff})

	// Add 3 and 4 to the combined Vpanel
	messagesTypingVPanel.AddWidget(messagesVPanel)
	messagesTypingVPanel.AddWidget(typingVPanel)

	mainHPanel.AddWidget(contactsVPanel)
	mainHPanel.AddWidget(messagesTypingVPanel)

	// now add mainHPanel to VPanel.
	vpanel.AddWidget(mainHPanel)
	return nil
}
Recently I’ve been wanting to develop some desktop (primarily Windows, but could also be considering MacOS or Linux) applications. Although Go isn’t the first language that springs to mind when it comes to developing an UI application the simplicity and robustness of the language still makes it my number 1 go to language. Yes, it’s my hammer… but it’s a damn nice hammer.
I’d previously used the Ebiten graphics library for Go for some games I’ve coded with my kids. But, for general “application” development (ie needing ‘widgets’ such as buttons, menus, etc etc) Ebiten isn’t really suited for that. So I’ve search about for Go UI libraries that I could use. Most out there use Cgo but I REALLY wanted my applications to be pure Go. This is purely a personal preference and I cannot give statistics/numbers on what the impact would be to use Cgo as opposed to Go. If I were to use Cgo I think the UI library of preference would definitely be Fyne. Fyne looks like a very comprehensive framework, and if you don’t mind Cgo I’d definitely recommend looking at Fyne.
There are some others about but nothing that I grabbed me. They say you should never write your own security/cryptography code and I truly believe that you shouldn’t write your own UI libraries. I’m ignoring that advice… 🙂
This is purely one of those “scratch your own itch” types of projects. It’s still VERY early on, but the basics of a UI library (with Ebiten doing the actual rendering) is slowly coming together. Before going through any details let me state here and now, I think programs peaked at the CLI. Secondly, I’m no UI coder… I think you’ll agree BUT in my defence I am writing this for me to consume. Bad styles be damned 😛
The basic idea of GoUI is that there are 2 broad types of graphics elements. One is a panel that can contain other panels or widgets. The other is a widget which is a basic UI element (button, textinput etc etc). The panel types we currently have a HPanel (adds things horizontally) and a VPanel (I’ll let you guess). Technically we do have other panels such as a Toolbar, but that is really just an HPanel with a little bit of custom work. Overall, if I can construct something “new” out of combining other existing panels/widgets then I’ll do it. If I need to optimise or diverge from what I already have, then I’ll make something brand new.
The widgets we have are currently:
ImageButton: (clicked/not-clicked images are supplied by the app).
TextButton: basic coloured rectangle with whatever text you want in it.
Checkbox: Same as TextButton but with a small box ticked or not ticked to the side.
EmptySpace: utter cop out by me. Used to force space between other widgets. Once I add proper padding this will probably disappear.
Label: box with text. Doesn’t do anything.
Text Input: can type in it.
RadioButtonGroup: This is a panel, which has a vpanel or hpanel (depending on a flag) that then has a number of checkboxes in it. The check boxes have the image (with a tick) replaced with the usual radiobutton circle. This is a good case of reusing an existing widget. If it turns out that I need to modify checkboxes enough that it wouldn’t be suitable to be repurposed as a radiobutton, then I’ll have to put in a real radio button. But for now, it’s working perfectly.
I’ve still yet to complete menus, modals windows etc etc. But as I’ve said… early days.
Firstly, the core of the program still calls out to Ebiten directly. Those are not wrapped/hidden yet. So you’ll see in the main and Run functions that we’ve basically making an instance of MyApp struct then we call SetupUI, set a few Ebiten flags and then call the MainLoop.
NewMyApp function calls pkg.NewWindow function. This is the MAIN window to the application. Once modals/other-windows are added this might change but for now, this creates the main UI window of a given size.
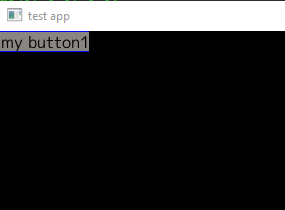
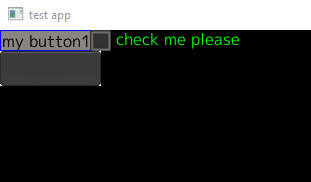
SetupUI is where you need to pay attention. The first thing we do is create a VPanel. Remember VPanels stack things vertically. We add the vPanel to the main window. In practice (currently) we should only ever add 1 panel to the main window, everything else should go into that panel. So in this case we create button1 (a new TextButton) and add that to the vPanel.
Let’s take a moment to bask in my UI skills.
*tumbleweeds….. *
Ok, lets do something more interesting. Say we want to react to when the button is pressed. The line that created the TextButton is:
I wont go into all the details, but the last parameter is to an event handler with the signature func(event IEvent) error. So, if we create a method with that signature and pass that in as a last parameter to NewTextButton, we’ll actually start seeing something.
Now when the button is clicked, the ButtonAction1 function will be called and we can trigger whatever functionality we like.
Easy.
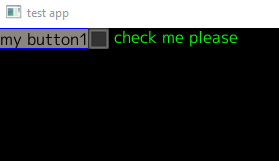
Now, what about if I wanted something next to the button (and I know I’ll eventually want something below the button). What we do here is to create a HPanel and put that into the VPanel first. Then we add the button to the HPanel. If we do this, we’ll end up having code like:
In this case we have 2 images (only one shown in the screen shot). One when pressed and one when not pressed (just changes the shading). You get the idea.
I’ll wrap up for here now… but so far I can produce functional (polite way of saying ‘ugly’) interfaces… but this will definitely improve!
As mentioned previously I’ve been developing a log mining library/tool based on the LogMine algorithm. In that blob post I was mining the mammoth log file containing 12 lines (whoa!), now for a more practical example.
Part of my day job is dealing with Jmeter. With great power comes great volumes of log files…. so time to get mining! Taking a subset of logs from a test system, I’ve got a nice set of approx 900k lines. Not huge but also large enough that if new messages of interest were to start appearing, I might not currently notice them. 200 similar log messages might be of interest, but would easily be overlooked in 900k lines.
Remembering Gologmine is still work in progress (but still definitely usable for my purposes), we can start investigating what it produces. Also remember that the whole idea of the LogMine algorithm is that individual log files are clustered together into more generic patterns. With each iteration we make each cluster more and more generic.
So, (don’t worry I wont copy all 900k log lines here), after the first level (0) of clustering, we get the patterns:
count 248 : pattern NUMBER Single Read Sampler,No * timeout, no response IPV4 xxxxxx Use NUMBER
count 549 : pattern NUMBER * - Present,Non HTTP response code: org.apache.http.conn.HttpHostConnectException,Non HTTP response message: Connect to * IPV4 failed: Connection timed out * timed IPV4 xxxxxx Use NUMBER
count 2883 : pattern NUMBER Open Connection,Websocket I/O error,WebSocket I/O error: connect timed IPV4 xxxxxx Use NUMBER
count 44966 : pattern NUMBER Single Read IPV4 xxxxxx Use NUMBER
count 45213 : pattern NUMBER Single Write Sampler - Camera Image,Sampler Error,Request data is not binary: IPV4 xxxxxx Use NUMBER
count 45214 : pattern NUMBER Single Write Sampler - Kayne IPV4 xxxxxx Use NUMBER
count 45214 : pattern NUMBER Single Write Sampler - Benny IPV4 xxxxxx Use NUMBER
count 45214 : pattern NUMBER Single Write Sampler - Vampire IPV4 xxxxxx Use NUMBER
count 45580 : pattern NUMBER Open Connection,101,Switching IPV4 xxxxxx Use NUMBER
count 48916 : pattern NUMBER * - IPV4 xxxxxx Use NUMBER
count 49731 : pattern NUMBER - IPV4 xxxxxx Use NUMBER
count 525011 : pattern IPV4 xxxxxx Use NUMBER
For this particular set of logs, most of the levels actually produce very similar output. But this is still worth noting some useful pieces of information.
Firstly, even at level 0 (most basic form of clustering) we can see that a timeout was triggered 248 times. Now, something with such as obvious word as “timeout” might already be the basis of an alert.. but what I want to show here is that in the raw logs none of the log lines are duplicated. Here we have discovered a pattern: NUMBER Single Read Sampler,No * timeout, no response IPV4 xxxxxx Use NUMBER
If we were purely looking through raw logs, these timeouts could very easily be missed. But when we are dealing with general patterns, information bubbles up easier for ops to consume.
Another item here is that we see 3 very similar log patterns referring to “Single Write Sampler”. One for Kayne, Benny and Vampire. Now, this information might be useful or maybe we’re just interested in the total logs of that type but not who it refers to. This is where moving to another level comes into play.
Lets try level 2
count 248 : pattern NUMBER Single Read Sampler,No * timeout, no response IPV4 xxxxxx Use NUMBER
count 549 : pattern NUMBER * - Present,Non HTTP response code: org.apache.http.conn.HttpHostConnectException,Non HTTP response message: Connect to * IPV4 failed: Connection timed out * timed IPV4 xxxxxx Use NUMBER
count 2883 : pattern NUMBER Open Connection,Websocket I/O error,WebSocket I/O error: connect timed IPV4 xxxxxx Use NUMBER
count 45213 : pattern NUMBER Single Write Sampler - Camera Image,Sampler Error,Request data is not binary: IPV4 xxxxxx Use NUMBER
count 48916 : pattern NUMBER * - IPV4 xxxxxx Use NUMBER
count 49731 : pattern NUMBER - IPV4 xxxxxx Use NUMBER
count 90546 : pattern NUMBER * IPV4 xxxxxx Use NUMBER
count 135642 : pattern NUMBER Single Write Sampler - * IPV4 xxxxxx Use NUMBER
count 525011 : pattern IPV4 xxxxxx Use NUMBER
By moving up a clustering level (2), the more generic the log patterns are. In this case the Kayne, Benny and Vampire are all merged into the single pattern (second last) and the count is a combination of the 3 earlier lines.
Another good example is the 4th one in the above list: count 45213 : pattern NUMBER Single Write Sampler – Camera Image,Sampler Error,Request data is not binary: IPV4 xxxxxx Use NUMBER . In this case we have 45k entries that have different details (timestamps, IPs etc) which are all unique… but here we have been able to generate a single pattern to detect this anomaly. We didn’t have to know if a string to search for, we simply had to run logmine across out logs and it automatically determined common patterns.
I’ll soon be integrating this into the monitoring/alerting system I use daily.
Recently I attempted to implement a Go version of the LogMine algorithm ( https://www.cs.unm.edu/~mueen/Papers/LogMine.pdf ). This was a partial success… success as in I can mine logs for patterns but a partial failure in that I could understand a large chunk of the algorithm (based off the paper and other presentations/videos I could find off the net) I couldn’t understand ALL of it. So the implementation I ended up with was mostly LogMine and some "Ken filled in the blanks with what his brain could handle". Disappointing, but hey, I’ve got working code 🙂
I looked at some other projects that attempted to do the same thing (mostly Python implementations) to see if reading code would make the ideas "click" in my head, but it turns out that these implementations (to my eye) stopped even earlier than I did (ie their implementations worked for them, but wasn’t the full LogMine)
Being able to generate patterns from existing log files has mostly been an exercise in regex-fu. I wanted to avoid this and try and come up with an implementation that could work on unknown log files that didn’t required any (or at least much) human tweaking/tuning. LogMine certainly filled the bill there.
As way of a quick explanation, I’ll steal the example the LogMine authors use themselves:
In this case you can see that if you ignore timestamps, IPs and even user names, then you can see there are basically 4 patterns of log messages that are appearing. "login", "logout", "DB Connect" and "DB Disconnect". You might be in a situation where you’re interested in these patterns.
When using the tool (or as a library) you can mine the logs and cluster the messages into groups of similar messages. Then you can keep expanding the boundaries of the clusters depending on how much detail is required).
In this specific case, we can perform the most general form of clustering with the results:
count 1 : pattern DATE TIME DB Disconnect IPV4 user = NOTSPACE
count 1 : pattern DATE TIME logout IPV4 user = NOTSPACE
count 1 : pattern DATE TIME login IPV4 user = NOTSPACE
count 1 : pattern DATE TIME DB Connect IPV4 user = NOTSPACE
count 2 : pattern DATE TIME DB Disconnect IPV4 user = WORD
count 2 : pattern DATE TIME logout IPV4 user = WORD
count 2 : pattern DATE TIME login IPV4 user = WORD
count 2 : pattern DATE TIME DB Connect IPV4 user = WORD
In this case you can see some elements of the messages have been generalised out (time, date, unique words etc)
Next, we can generalise the clustering to the next level and get:
count 3 : pattern DATE TIME login IPV4 user = NOTSPACE
count 3 : pattern DATE TIME DB Connect IPV4 user = NOTSPACE
count 3 : pattern DATE TIME DB Disconnect IPV4 user = NOTSPACE
count 3 : pattern DATE TIME logout IPV4 user = NOTSPACE
Again, we can see we have 12 entries (totalling the counts) and we can also see that in general we have 4 types of messages. login, logout, DB Connect and DB Disconnect.
If we take it one step further we start getting into the situation of very generalised messages:
count 6 : pattern DATE TIME WORD IPV4 user = NOTSPACE
count 6 : pattern DATE TIME DB WORD IPV4 user = NOTSPACE
Here we’re simply breaking it down to messages that happened to have "DB" in it and those that didn’t.
We can take it one final level, but in this situation (although producing correct results) aren’t overly useful:
count 12 : pattern DATE TIME * WORD IPV4 user = NOTSPACE
At each level, the same number of logs are being represented (12) but with varying levels of details. For this specific test log, maybe the second set of results were the most useful. At level 1 (second set of logs) we know there are 4 general sets of messages, login, logout, DB Connect and DB Disconnect.
My plan for this is to connect it to some existing logging tools I’ve got (in particular https://github.com/kpfaulkner/ddlog ) and let me detect any new patterns of logs that appear in the production logs and alert on them. I can do this without having to KNOW about every single log message format coming into the system. If a new pattern appears over X times within a certain time duration then I’ll end up getting alerted on it for me to determine if this is something I need to pay attention to or something more benign.
I’ve first created the basis of Wheatley (my Slack bot) a few years ago during a hackathon. Now, I’ve used it at multiple companies helping me with various ops processes as well as adding in any little functionality that will help my co-workers. Normally I run it in a VM (both Windows and Linux, being that it’s Go based I can compile for most things), but have recently decided to add an option of running it as an Azure Function.
I was impressed how trivially easy this was. Kudos to both Microsoft for finally making it easy to make a Go based Azure Function, but also to Slack for allowing various alternate APIs to integrate against.
For details about making an Azure Function in Go, please see my previous post. What I’d like to highlight here is the Slack specifics I had to do to get AFs working properly. The initial hurdle was that Wheatley only used the RTM (real time communications) protocol, which is basically a fancy was of saying websockets. Now, my main aim for using Azure Functions is that I only wanted to have it running when I needed it and not to have hosted compute always running and always having connections to the various clients. Fortunately, Slack has an alternate option called Event API. Events API is basically just falling back to the good old REST protocol…. given how infrequent the messages really are in Slack (in the big scheme of things) REST works for me nicely.
Jumping across to my Slack library of choice, Slack-go also provides Event API functionality as well as the already used RTM functions. Cool… no switching libraries!
Basically the way Wheatley is designed, very little of it is Slack specific. Sure, receiving and sending messages are obviously Slack specific but those are just some very small touch points. Most of the code is integrating with other systems which has absolutely nothing to do with Slack. So, let’s look at the older RTM based code.
api := slack.New(slackKey)
rtm := api.NewRTM()
go rtm.ManageConnection()

for msg := range rtm.IncomingEvents {
  switch ev := msg.Data.(type) {
  case *slack.MessageEvent:
    originalMessage := ev.Text
    sender := ev.User

    // lets just echo back to the user.
    rtm.SendMessage(rtm.NewOutgoingMessage(originalMessage, ev.Channel)
  default:
  }
}
So, we have some pre-defined slackKey (no, not going to tell you mine), we establish a new RTM connection and basically just sit in a loop getting the latest message and replying. Obviously Wheatley does a lot more, see github for the exact details.
So effectively we just need something similar without the websockets shenanigans.
There’s a bit more handshake ceremony going on, but really not much. Instead of 1 token (above called slackKey) there are 2. The one already mentioned and another called the verification token. This token is used to confirm that the messages you’re receiving are actually for this particular instance of the bot.
Fortunately our HTTP handle func is the same type we’re all used to in Go. The highlights of the function are follows:
var slackApi = slack.New(token)   // same token as RTM...
func slackHttp( w http.ResponseWriter, r *http.Request) {

  // read the request details.
  buf := new(bytes.Buffer)
  buf.ReadFrom(r.Body)
  body := buf.String()

  // ug, hate the wordpress formatting, but basically we're using the
  // Slack-go API to parse the
  // event we've received. In this part we also confirm that the
  // VerificationToken we received matches
  // the one we already have from the Slack portal (variable
  // verificationToken)
  eventsAPIEvent, e := slackevents.ParseEvent(json.RawMessage(body),
    slackevents.OptionVerifyToken(
    &slackevents.TokenComparator{VerificationToken:
    verificationToken}))
  if e != nil {

    // verification token not matching... bugger off.
    w.WriteHeader(http.StatusUnauthorized)
    return
  }

  // Check that we're the bot for this acct.
  // Taken directly from the slack-go event api example :)
  if eventsAPIEvent.Type == slackevents.URLVerification {
    var r *slackevents.ChallengeResponse
    err := json.Unmarshal([]byte(body), &r)
    if err != nil {
      w.WriteHeader(http.StatusInternalServerError)
    }
    w.Header().Set("Content-Type", "text")
    w.Write([]byte(r.Challenge))
  }

  // Dealing with the message itself.
  if eventsAPIEvent.Type == slackevents.CallbackEvent {
    innerEvent := eventsAPIEvent.InnerEvent
    switch ev := innerEvent.Data.(type) {
    case *slackevents.MessageEvent:

      // return 200 immediately... according to https://api.slack.com
           /events-api#prepare
      // otherwise if we dont return in 3seconds the delivery is
      // considered to have failed and we'll get another
      // message. So can return 200 immediately but then the code that
      // processes the messages can
      // return their results later on
      w.WriteHeader(http.StatusOK)

      originalMessage := ev.Text
      sender := ev.User

      // again, we'll just echo it back.
      slackApi.PostMessage(ev.channelID, slack.MsgOptionText(
        originalMessage, false))
    }
  }
}
If you’re interested in the real Wheatley version (that’s wrapped in the Azure Function finery) then check on github.
The most awkward part is getting the bot permissions correct in the Slack Portal. So far for the basic messaging I’m needing the permissions of: users:read, app_mentions:read, channels:history, chat:write, im:history, mpim:history, mpim:read are useful. These are set in both the Event API part of the portal and the OAuth section.
After a few more days of testing this out on my private Slack group I think Slack + Wheatley + Azure Functions are ready to be unleashed on my co-workers 🙂
From an operations point of view remotely executing commands on a machine is critical for anything beyond a few machines. In the Windows world the way I’ve usually done this is allowing remote powershell…. but I’ve recently realised (I’m slow on the uptake) that I can do this the Azure CLI. If I can do it with the Azure CLI (az) it means there is a REST API… If there is a REST API it means I can tinker.
Proceed with the tinkering!!
First thing’s first. The az command to achieve this is:
az vm run-command invoke --command-id RunPowerShellScript --name my-vm-name -g my-resourcegroup --scripts 'echo \"hello there\" > c:\temp\ken'
Now the fun bit. To run some arbitrary bit of powershell ( which is scary enough ) the REST endpoint is :
So the powershell could be the REAL commands…. format a drive, start the bitcoin miner etc etc…. OR… in my case I simply want to execute the powershell that has already been installed on the remote machine and has been verified as safe 🙂
I’m going to incorporate this remote execution into some tools I maintain for my own use (all in Go), so the entire program boils down to something pretty small. Firstly auth against a service principal in Azure, then with the generated token execute the POST. Auth with Azure is simplified with using my tiny AzureAuth project :
This is obvious with all the error checking removed etc (just to reduce the clutter here).
Now, one important thing to remember. If you want immediate (or even just vaguely quick-ish) execution of your scripts, executing Powershell via Azure REST APIs is NOT the way to achieve this. Even a simple Powershell script to write a hello world file might take 20 seconds or so.
The benefit of this (to me at least) is not enabling general remoting to the Azure VM, no fiddling with firewall rules etc etc. It’s using the Azure REST API (that I use for SOOO many other reasons), using the same type of authentication, same way to integrate into my other tools. It mightn’t fit everyones need but I think this will definitely be my remoting process going onwards (for Azure VMs)
See here for simple implementation. Don’t forget to create a service principal and assign it VM Contributor rights to the VM you’re trying to remote to!
Note: I forgot to mention that so far, due to a bug in the Go runtime, I can only get binaries created from Go 1.13 to work. Have filed a bug and will see how things go.
Azure has finally made it possible to write Azure Functions in any (well virtually) language you like. Yes, it’s just a redirection layer to your pre-compiled executable/script but hey, it works…. and it works with GO 🙂
Firstly, you’ll want to read about Azure Custom Handlers , also if you’re interested in Go, check out the samples . The samples include triggers for HTTP, Queues, Blobs etc. For now, I just want to focus on the HTTP triggers. They have seriously made this so easy, in particular running locally vs in an Azure Function is literally a line or two of changes.
Firstly, the image on the Azure Custom Handlers needs to be studied before we go anywhere.
Basically the Functions Host is just a redirection layer to our REAL function, which is basically a webserver. Yes, this is a hack… no question about it… BUT… it’s exactly what I’m after. We can use ANY language we want, as long as it handles HTTP request. Yes, there are overheads compared to not having this indirection layer, but really, I’m WAY more than satisfied with this approach. I’m just glad they didn’t insist we all use Docker containers for everything.
So, as long as we can run a tiny webserver we’re good. Fortunately, Go (and most languages out there these days) come with half decent HTTP servers built in.
For a simple Go example, I’m using:
package main

import (
	"fmt"
	"log"
	"net/http"
	"os"
)

func doProcessing( w http.ResponseWriter, r *http.Request) {
  fmt.Fprintf(w,"testing testing 1,2,3")
}

func main() {
	port, exists := os.LookupEnv("FUNCTIONS_HTTPWORKER_PORT")
	if !exists {
		port = "8080"
	}
	http.HandleFunc("/testfunction", doProcessing)
	log.Fatal(http.ListenAndServe(":"+port,nil))
}
It simply responds to a GET request to /testfunction with a string. Not exciting, but it will do for now. You see that the only change between local and Azure Function versions is the port. If the environment variable FUNCTIONS_HTTPWORKER_PORT exists, then it will use that as the port number, otherwise defaults to 8080 for local env.
Next there are 2 required files, host.json which basically says how the AzureFunction will run, ie what’s the executable that’s going to be the webserver. Mine is:
Where azurefunctiongo.exe is the executable generated from the above Go code.
Finally there is function.json, this is the binding about a particular function. So in my case I was interested in a HTTP trigger, so my function.json looked like:
It can handle GET and POST (although my code is currently only GET). Incoming is HTTP and output is also HTTP. You might want situations where the input (ie trigger) is HTTP but the output is putting a message onto an Azure Queue for example. The Azure Customer Handler page linked above covers all of this.
Now, all of these just get uploaded to the usual wwwroot of an App Service Plan (will automate that soon) and away you go! (note, make sure you the exe and host.json are in the wwwroot directory, and the function.json is in a subdirectory of wwwroot called whatever your endpoint is called, in my case testfunction)
Now that Azure has this going, I can see SOOOOO many use cases for my projects. Thankyou thankyou thankyou Azure!!!
After a little tinkering about with Github Actions, I decided to write one to scratch an itch I’d been having at work. Github actions react to various events , one of which is Github wiki updates (awesomely named as Gollum events). Unfortunately the various actions I tried from the market place (which take events and then ping slack with details) simply sent a message saying a wiki page was updated and never actually said WHICH page was updated. So I decided it was probably worth while to write up my own to learn how Github Actions work under the covers.
Now, most of what I learned I got off Jacob Tomlinsons great post. I won’t reproduce what he already covers (far better than I could), but just wanted to list a few points that took me a little to realise.
Firstly, it’s in the YML file (an action is configured by yaml… I wont comment) that event types are configured. So in the case of reading wiki/gollum events, the yaml file will have an "on: gollum" entry. This means that the rest of the action (which is compiled on each execution) won’t actually get run except when it’s really needed.
Secondly, if you just want to run something when a particular event is triggered you don’t actually need to read the payload (with a TONNE of info in it). This is what a lot of actions seem to do, but for my situation where I needed to know which wiki page was updated, I needed the specifics. For the specifics you’ll need to read an environment variable (see big list) called GITHUB_EVENT_PATH. This is a path to a file that you then read, and this file has all the specifics of the event triggered. Although some might scoff at the relatively low tech approach to this, I really like it. Read filename from environment variable, then read the file. Easy peasy.
The file is simply JSON (see the events link earlier) and you can deserialise into a class/struct/whatever-suits-your-language easily enough. From there, grab the info you want and pass that to Slack. In the case of Go, the wonderfully useful Json-to-Go site makes this trivial.
Now that I’ve got to grips with writing actions in Go, I’m certain I’ll be writing more. There are many cases where I can picture them being VERY useful in my day-to-day work.