Grafana has done a wonderful job making it easier to create Datasource plugins. Previously I’d found it extremely painful to do but now, it is a breeze and a lovely experience. Disclaimer…. I’m talking about the Go based ones…. absolutely no idea about any other backend plugins.
Before reading this post, go and do yourself a favour and go and read their tutorial around this.
I’ll wait….
Back? good.
So far I’ve written up 3 datasource plugins that I’ve personally found useful in my day job. These are Datadog logs, Sendgrid stats and Azure Costs . Each of these follow the exact steps set out in the Grafana tutorial linked above.
Datadog Plugin
Grafana already has an official Datadog plugin, but 1) it’s for Enterprise customers only… and 2) I just need some basic log dashboards and not monitoring around everything Datadog does. The DD plugin I wrote simply graphs out the counts of log entries based on custom queries. My custom queries is virtually always "how many errors in prod" since hey, that’s what I REALLY care about. Certainly plenty of optimisations I need to get around to doing (like calling DD stats APIs as opposed to actually getting the logs and counting them)
SendGrid Stats
I monitor/alert on multiple Sendgrid accounts, so it’s useful to have a graph of the usual SendGrid stats (sent, bounced, blocked etc etc). Very convenient for a single place to glance at multiple accounts to see how things are tracking.
Azure Costs
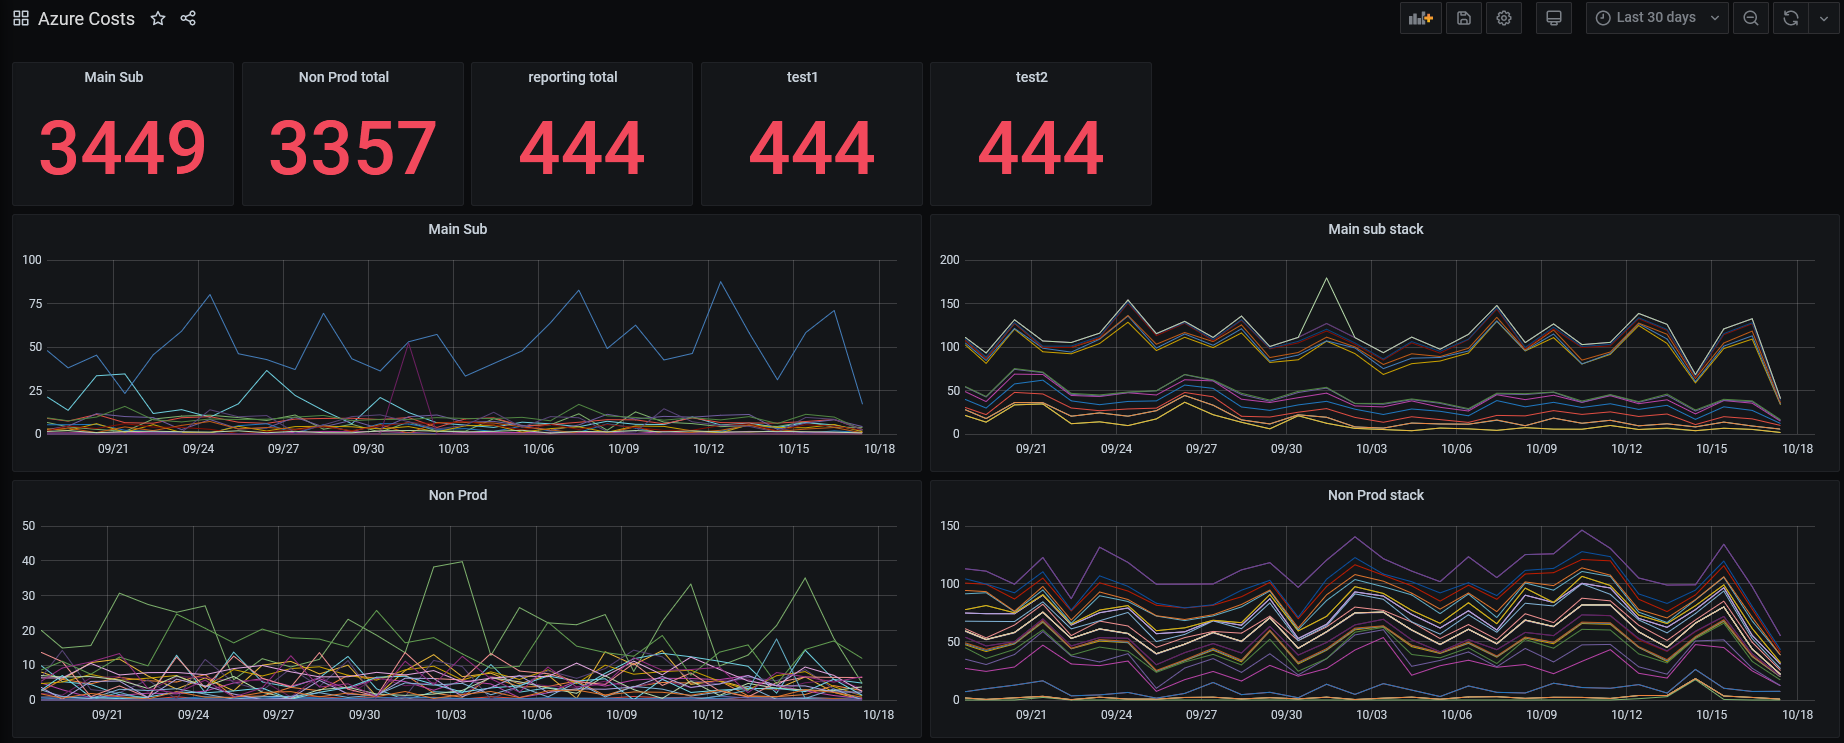
This will probably be the most useful (to me) of the three I’ve written so far. Monitoring Azure Costs (at subscription or resource group level) is always fun if you’re just bouncing between various screens on the Azure Portal. Of course there are already other services that I can subscribe to for summaries and deep dives into expenses, but what I was really after is a simple set of line graphs showing the various expenses for subscriptions and resource groups. This way I can easily see what services are creeping up in costs, or if something has been scaled up for too long. One useful thing I’ve found is generating 2 sets of line graphs with the same data. One stacked and the other not.
The stacked graph allows me to basically see how much a particular subscription is costing me per day, the non-stacked makes it easier to determine which individual resource group is costing the most.
Example of this dashboard :
Again, plenty of work to do on this one, in particular a mutex that protects a cache is far too coarse and not fine grain enough. It basically forces all queries to be serial instead of concurrent. But… given the data only updates once every 24 hours for Azure Costs it really isn’t a concern for me right now. This definitely gives me the "glanceability" I’m after.
I thoroughly recommend anyone who has given Grafana backend coding an attempt in the past and gave up, give it another go… it’s such a good experience.
(or ping me, I’m always up for new side gigs 😛 )
